All Liinks users can see how many times each link was clicked on their page. To access your analytics, click Analytics in the left sidebar.
Performance snapshot
At the top of the analytics page, you'll see a row of snapshot cards that give you a quick summary of how your page is doing for the selected time period:
- Unique Visitors — How many individual people visited your page, with a percentage change compared to the previous period.
- Page Views — How many times your page was viewed in total (one visitor can create several views), with a percentage change.
- Clicks — Total clicks across both your links and your social icons, with a percentage change.
- CTR — Your click-through rate: clicks measured against page views, so you can see how engaging your page is regardless of how much traffic it gets.
- Engagement — The share of your visitors who clicked something, rather than looking and leaving.
- Top Link — Your most-clicked link for the period and its click count.
Under the tiles, a Beyond your page line counts your QR code scans and short link clicks, so activity that never lands on your page still gets credited.

The snapshot automatically compares your current period to the previous one (e.g., this week vs. last week, or this month vs. last month), so you can quickly spot trends.
Live visitors
Under the snapshot, a Live card shows who is on your page right now, as a feed of the last day's activity with a globe beside it plotting where those visitors are.
Each row is one visitor, anonymized and numbered in the order they arrived ("Visitor #4"), with the country and city we could resolve and what they did: viewed your page, clicked a block by name, clicked a social icon, scanned your QR code, or followed a short link. A counter at the top right shows how many people arrived in the last 30 minutes.
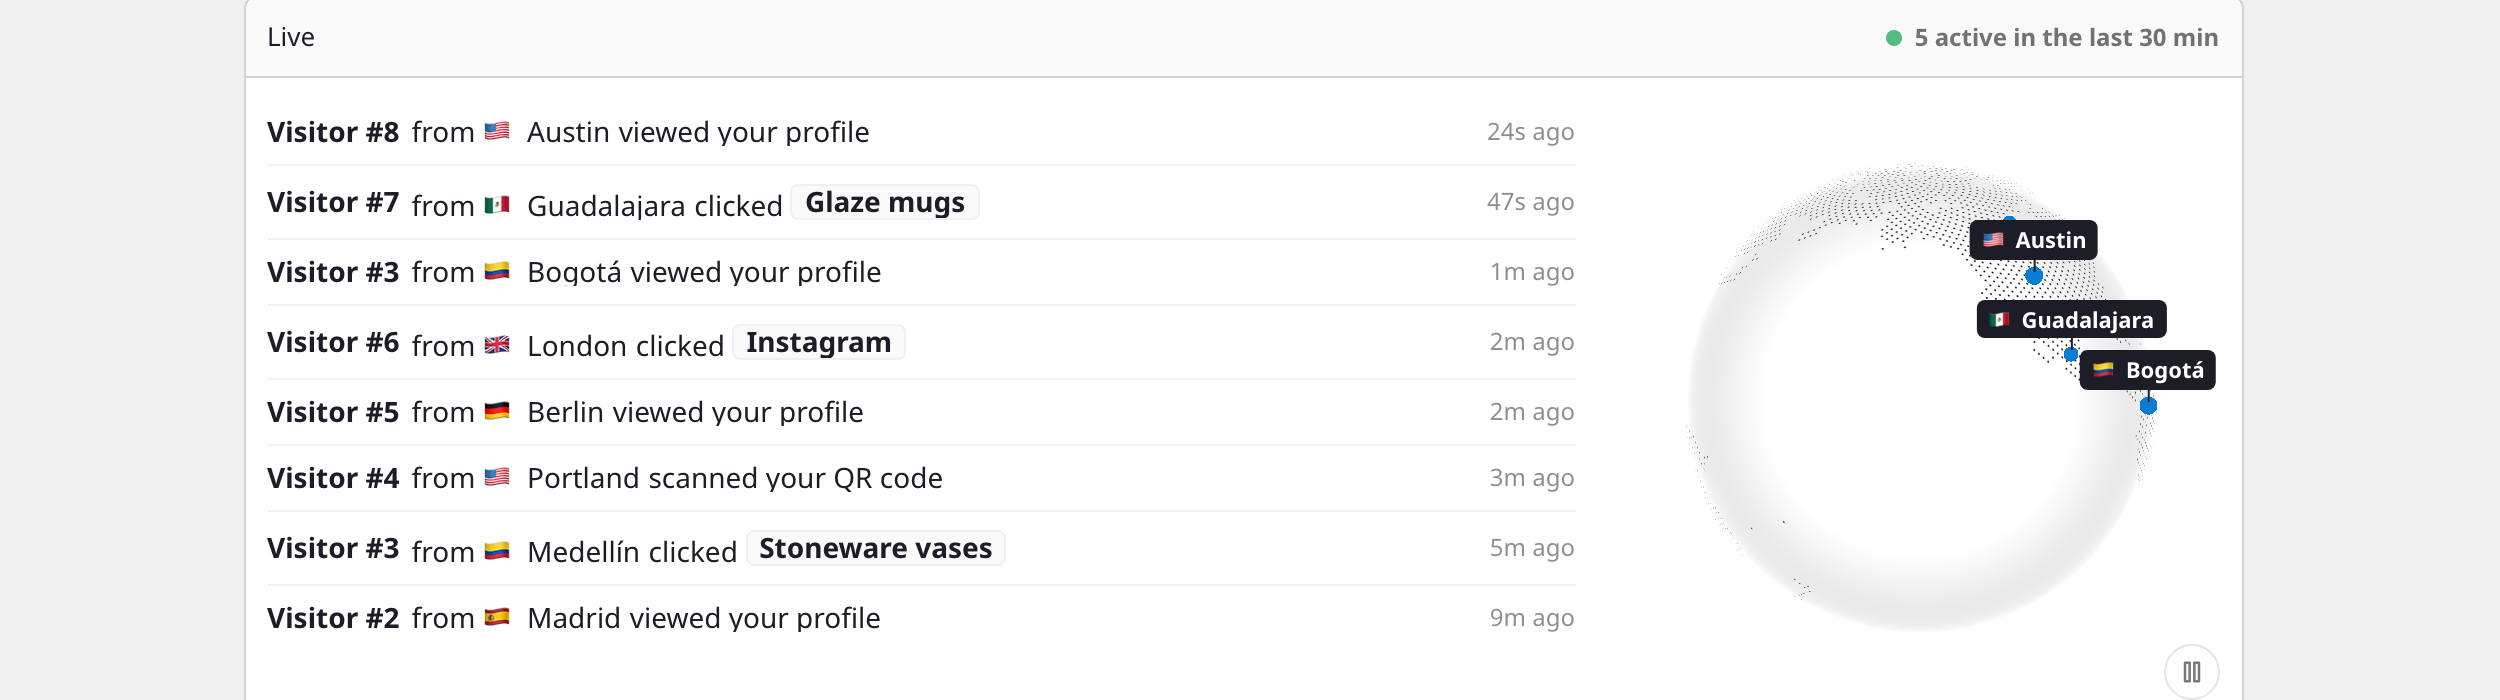
The card refreshes on its own, more often while people are arriving and less when things are quiet, and it pauses entirely when the tab is in the background. When there has been no recent activity it hides itself rather than showing an empty feed, and when there are only a handful of events it shows a prompt to share your link instead.
You can drag the globe to spin it, and pause its rotation with the button in its corner.
Time ranges
Use the dropdown at the top to change the time period:
- Today — Today so far vs. yesterday.
- This Week — This week vs. last week.
- This Month — This month vs. last month.
- This Year — This year vs. last year.
- Custom Range — Pick specific start and end dates (up to 2 years apart).
Charts
Below the snapshot, the Page Views & Clicks chart shows three data series over time: Page Views, Block Clicks, and Social Clicks. Use the interval picker to switch between Hourly, Daily, Weekly, or Monthly buckets (available options depend on the selected time range — the Today range buckets by hour, for example). You can also toggle between Totals and Uniques to see all visits or only unique visitors.
Click Export to download your analytics data.
Audience breakdowns
Below the chart, the Audience section breaks your visitors down by where they came from and what they used to view your page, as a set of ranked lists:
- Locations — The countries your visitors are browsing from.
- Traffic sources — How people reached your page, grouped into channels like Social, Search, Direct, Referral, and QR.
- Top referrers — The specific sites and apps sending you traffic (for example, Instagram, Google, or TikTok).
- Devices — Whether visitors are on mobile, desktop, or tablet.
- Browsers — The browsers your visitors use.
- Campaigns — Traffic tagged with UTM campaign links, so you can measure specific promotions.
Each breakdown respects the time range and updates as you change it.
Filtering by a breakdown
Click any row in a breakdown to filter the whole dashboard by that value: the snapshot cards, chart, and every other breakdown re-scope to just those visitors. Active filters appear as removable chips above the snapshot cards, so you can stack several (for example, Mobile visitors from Instagram) and clear them one at a time. This makes it easy to answer questions like "how many of my QR-code visitors were on mobile?" without leaving the page.
Link-level analytics
Each link on your page tracks its own click count. Open the Link Analytics panel from a link's action menu to see a clicks-over-time chart and a sortable table of all your links with their click totals.
You can also set a Click Goal on any URL link to show a live progress bar on your public page, great for pre-orders, sign-ups, or fundraising. See Click Goal for details.